simple bbimage
simple bb
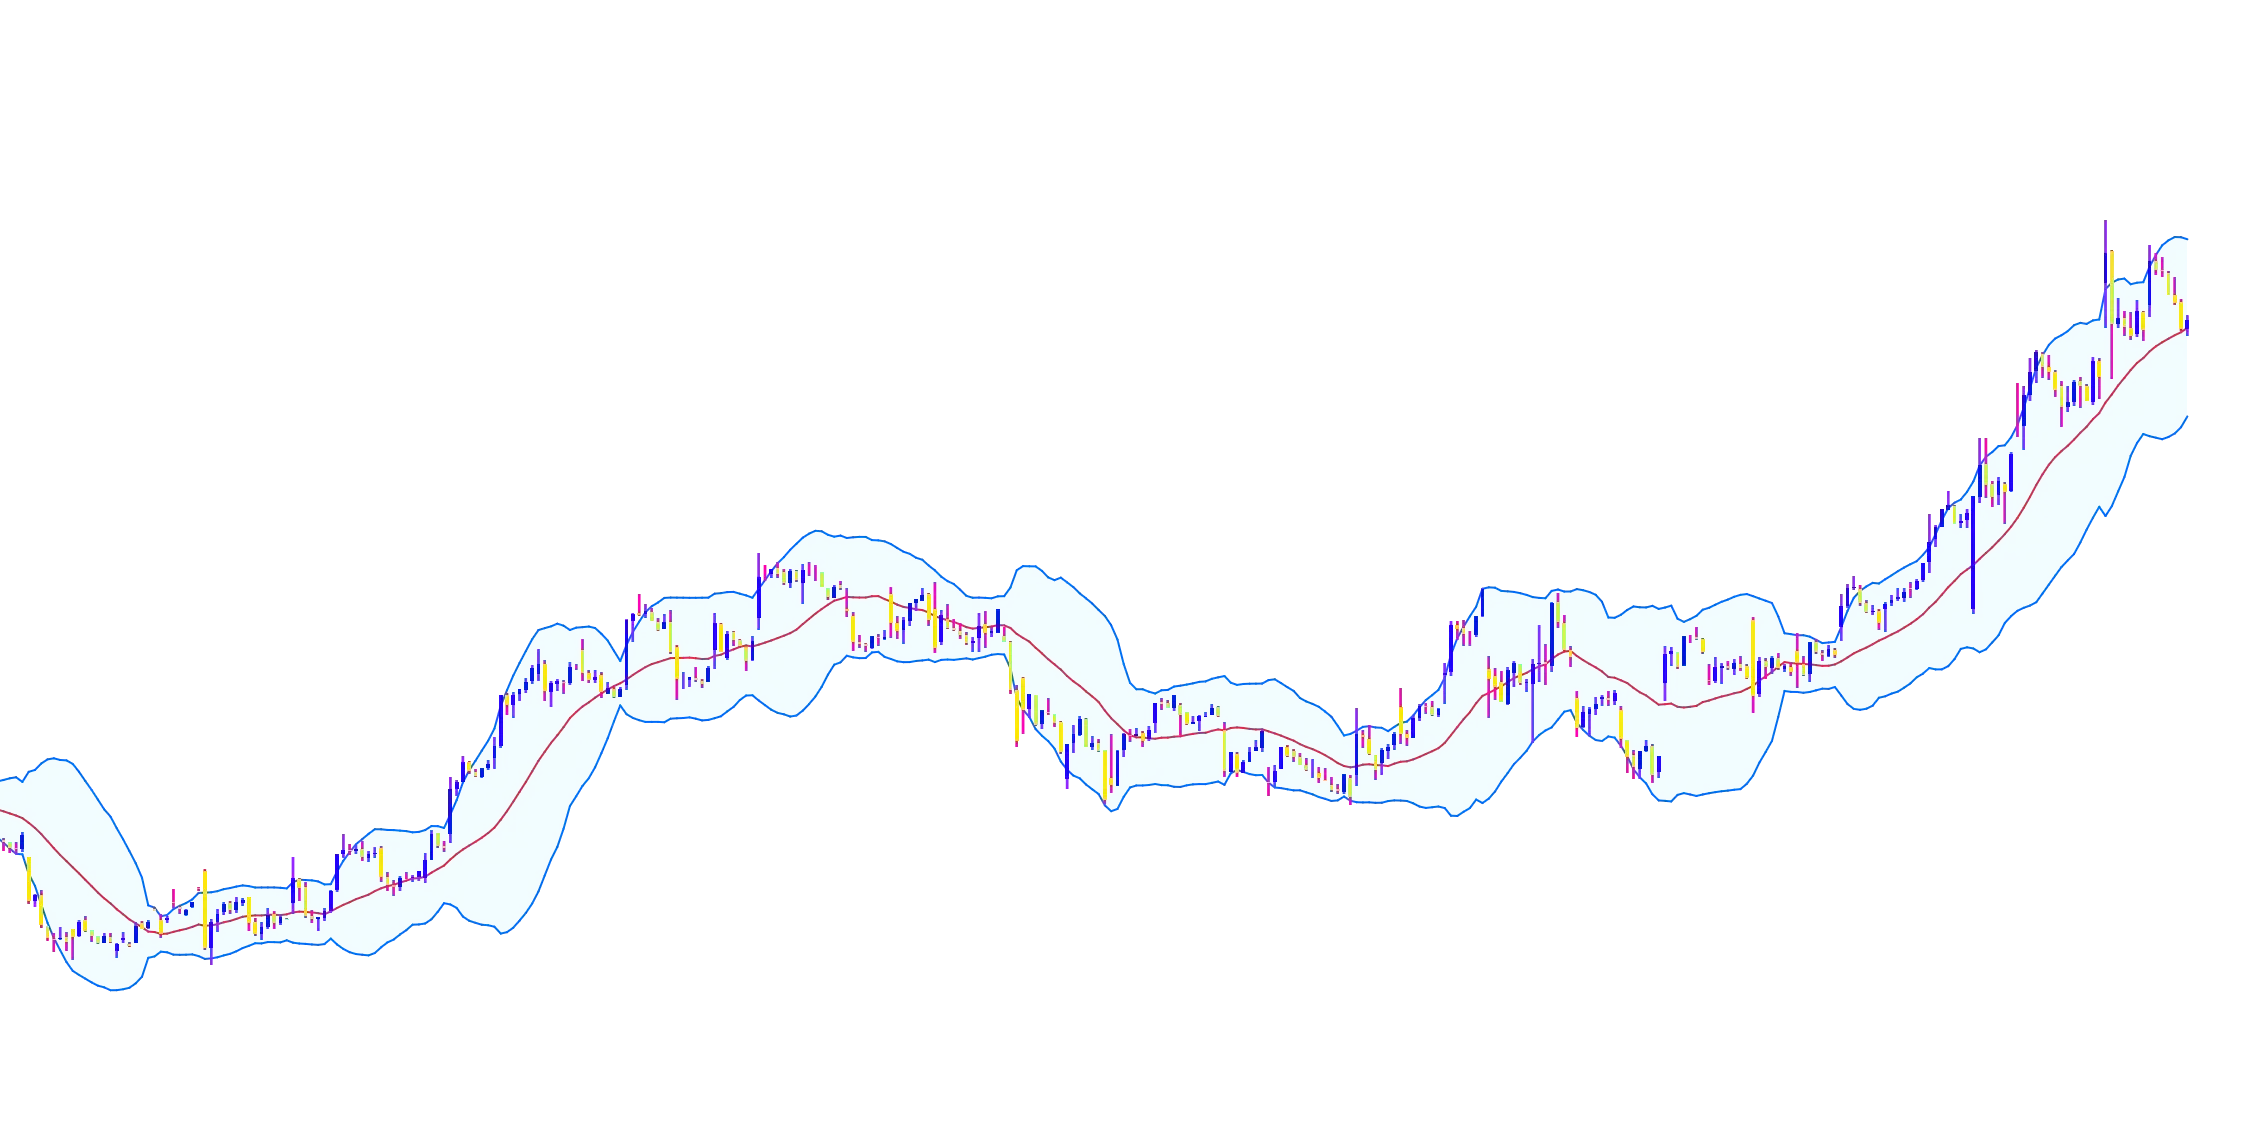
The Bollinger Bands indicator is  useful for understanding various market signals . By analysing how prices interact with the upper, middle, and lower bands, traders can assess volatility, identify potential reversals, and spot breakout opportunities. Le…
/indicator/simple-bb-93
My Ind141(2)image
My Ind141(2)
My Ind141(2) My Ind141(2)My Ind141(2)My Ind141(2)My Ind141(2)My Ind141(2) My Ind141(2) My Ind141(2)My Ind141(2)My Ind141(2)My Ind141(2)My Ind141(2) My Ind141(2) My Ind141(2)My Ind141(2)My Ind141(2)My Ind141(2)My Ind141(2) My Ind141(2) My Ind141(2)My Ind1…
/indicator/my-ind141-2-51
Support PlotDisplayOptions by RSimage
Support PlotDisplayOptions by RS
https://linear.app/takeprofit/issue/TP-2291/support-plotdisplayoptions-in-dashboardhttps://linear.app/takeprofit/issue/TP-2291/support-plotdisplayoptions-in-dashboardhttps://linear.app/takeprofit/issue/TP-2291/support-plotdisplayoptions-in-dashboardhttps…
/indicator/support-plotdisplayoptions-by-rs-37
marketplace testimage
marketplace test
test  sdfsdfsfsdfsd,fnlsdfksjdkf sdfsmdflks;ldkf;ksd;lfk;sldkf;lsdkf;lksdlfkldskf;lskdf  test  test  test  test  test  test  test
/indicator/marketplace-test-21
My Custom Relative Strength Index(1)image
My Custom Relative Strength Index(1)
The relative strength index (RSI) is a  momentum indicator  used in technical analysis. RSI measures the speed and magnitude of a security's recent price changes to detect overbought or oversold conditions in the price of that security. The RSI is displa…
/indicator/my-custom-relative-strength-index-1-12
AOimage
AO
My Custom Awesome Oscillator(1)My Custom Awesome Oscillator(1)My Custom Awesome Oscillator(1)My Custom Awesome Oscillator(1)My Custom Awesome Oscillator(1)My Custom Awesome Oscillator(1)My Custom Awesome Oscillator(1)My Custom Awesome Oscillator(1)My Cus…
/indicator/ao-80